At first glance, word clouds might seem like a pretty basic or novelty type of chart. But don’t be fooled – when used right, they can provide some really useful insights. Word clouds allow you to quickly identify trending topics, popular keywords or phrases, and the overall focus of open-ended responses without having to carefully comb through large amounts of unstructured data.
In this post, I’m going to show you how to make a Tableau word cloud. We’ll go through preparing your data, building out the visualization step-by-step, and customizing it to tell your specific story. By the end, you’ll be on your way to gaining a powerful perspective from your textual data through this underrated but highly impactful chart type. Sound good? Then let’s jump in!
Table of Contents
How to Create a Tableau Word Cloud (step-by-step)
Step 1: Prepare the Data
Before we can launch our word cloud rocket, the data needs to be in pristine condition. Here’s what you’ll need to do at this stage:
• Collect words and their counts
Your data should contain two columns – one for the individual words or terms, and another listing how frequently each one appears. This can come from analyzing text documents, transcripts, surveys, etc.
For example:
| Word | Frequency |
|---|---|
| Tableau | 25 |
| Visualization | 15 |
| Data | 30 |
• Remove non-words
Remove rows with symbols, numbers, etc. We only want our true words.
• Blast off stopwords
Common words like “the”, “and”, “but” add little value. Export stopwords lists are available or create your own based on your content. Filter them out now.
• Clean up spelling
Check for and correct any spelling/coding errors so word variations group together correctly.
Step 2: Connect the Data
Now that our data is prepped and polished, it’s time to introduce it to Tableau. Let me walk you through setting up that initial connection:
• Navigating the data source page
In Tableau, select “File” then “Connect to Data”. Select the appropriate data file type from the options.
• Linking up your word cloud
If connecting an Excel or CSV file, select the corresponding file. For databases, enter connection details here as well. Tableau will detect and display the available fields.
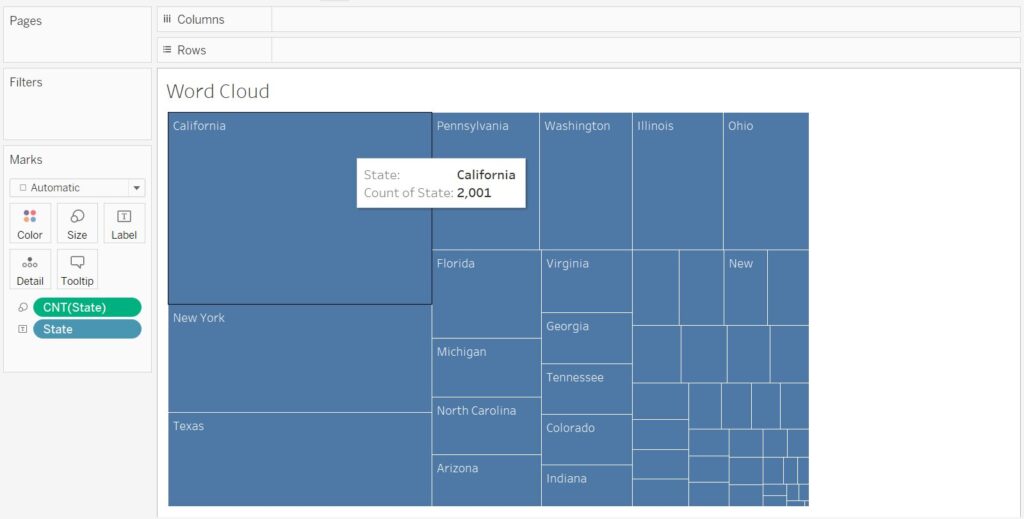
• Specifically for our word cloud:
- Select the prepared Excel/CSV file
- Tableau will detect the “Word” and “Frequency” columns we need
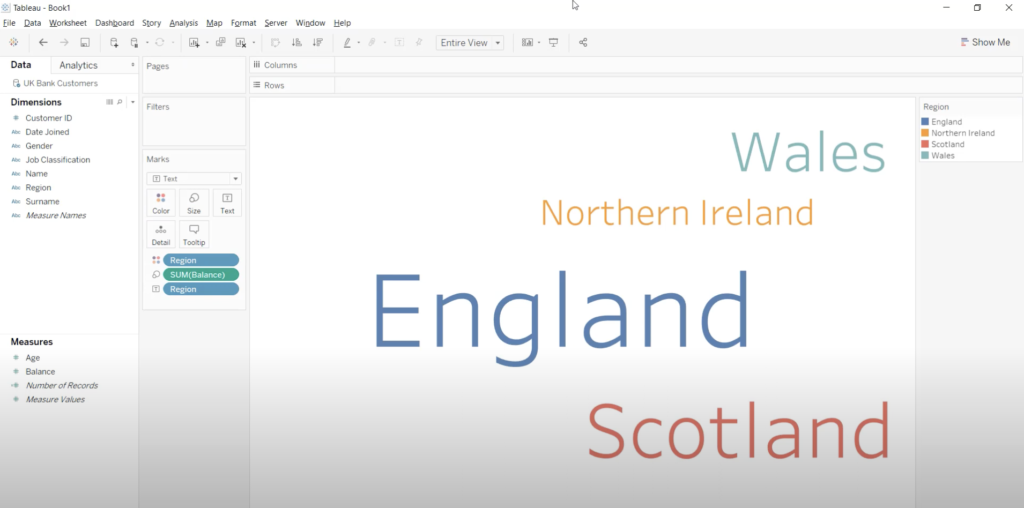
That’s it for the connection part! Tableau understands this is word cloud formatted data now. It’s ready to be molded into a visualization.
• Don’t forget your workbook
Now that our data source is created, click “Create” to insert it into a new workbook and start shaping our wordy masterpiece on the next page.
Frequently Asked Questions
Can Tableau make Word clouds?
Yes, Tableau can create word clouds. Connecting to your data source, drag the dimension containing the words you want to visualize to the “Text” shelf on the Marks card. Then, drag a measure representing the frequency or importance of each word to the “Size” shelf.
How do I create a Tableau in word?
If you want to incorporate Tableau visualizations into a Word document, here are your options:
– Export as an image.
– Embed interactive content.
– Create a PDF and insert.









Leave a Reply