
Feeling overwhelmed by all those rows and cells of raw data in your Excel sheets? Need a way to spot patterns and draw out insights, but charts just aren’t cutting it? Well stop stressing, because help is here in the form of the ultimate guide on how to create an Excel word cloud!
Table of Contents
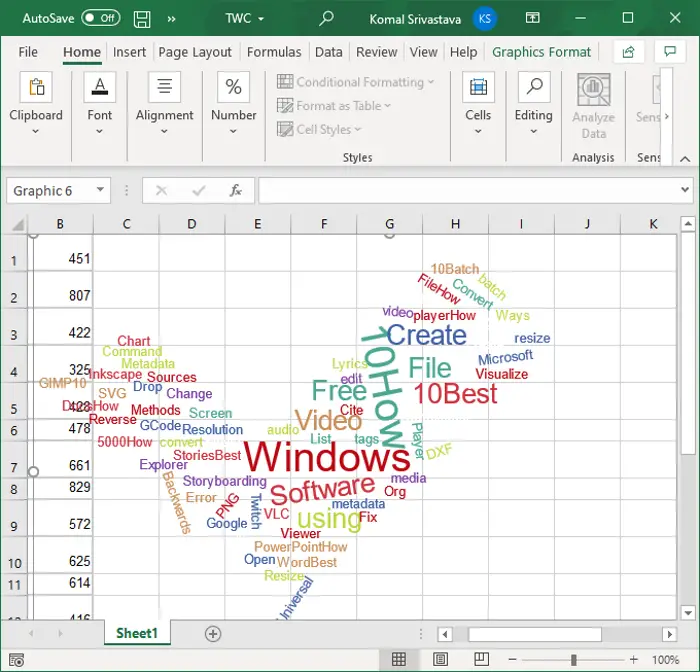
What is Word Cloud in Excel?
A word cloud is also commonly known as a tag cloud in Excel.
Word clouds have many uses in different areas like marketing, social media analysis, and education.
For marketers, word clouds are word whisperers, translating customer insights into valuable call-to-action moves. It can help us make improvements to our products or services based on what customers are saying.
In education, word clouds are used to peek through student feedback. They help us pinpoint areas where we can improve our teaching methods by examining the words that students often use in their feedback.
For social media analysts, word clouds are handy for identifying the most popular topics or hashtags in a specific conversation or event. By looking at the word cloud, we can quickly grasp what the buzzes are all about.
1. Install a Word Cloud Add-in
- Excel doesn’t have a built-in Word cloud feature, so you’ll need to install an add-in.
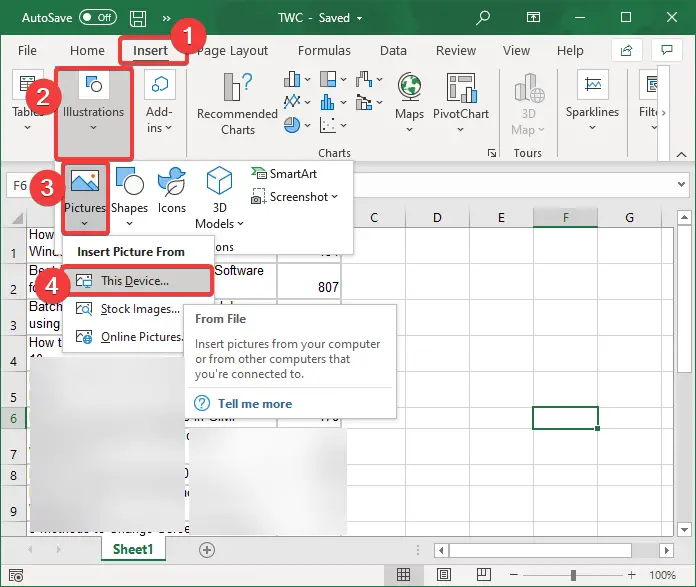
- Go to the “Insert” tab in Excel.
- Click on “Get Add-ins” (or “Office Add-ins” in newer versions).
- Search for “Word Cloud” and install one of the available add-ins.
- Install the Word Cloud add-in in Excel.
2. Prepare Your Data
- Make sure your text data is in a single column in your Excel sheet.
- Optional: If you want to exclude common words like “the,” “and,” or “of,” create a list of these “stop words” in a separate column.
3. Create the Word Cloud
- Click on the “Word Cloud” button that has now appeared in the “Insert” tab.
- A pane will open on the right side of your Excel window.
- Select the column containing your text data.
- Optional: If you have a stop word list, select that column as well.
- Choose other options like the maximum number of words or font size.
- Click “Insert” to generate the word cloud.
4. Customize (Optional)
- Many Excel word cloud add-ins allow you to customize the word cloud’s appearance, such as colors, fonts, and layout.
5. Interact with Your Word Cloud
- Most Excel word cloud add-ins let you click on words in the word cloud to see their frequency or related text.
Creating an Excel word cloud requires extra steps for it to appear. If you’re looking for a less complex one, consider trying our word scatter generator or the best word cloud generators we’ve hand-picked for you!
More Excel Word Cloud Tips
- Source data can be typed lists or imported from other files/databases. Make sure it’s one column with words.
- For better visualization, clean your list by removing common words like “and, the, a” that don’t provide useful insight.
- You can assign a frequency column if available, or weights can be generated automatically based on word count.
- Customization options let you choose cloud shapes (word art, shapes, tags), colors, rotation, effects like shadows.
- Font size maps proportionally to word frequencies – most common terms appear largest.
- Excel’s default scatter plot parameters work well but you can tweak markers, lines, scaling if desired.
- Generated word clouds can be saved as images directly in Excel files or exported as PNG, JPG etc.
- Interactive charts can be copied/pasted into PowerPoint to include in presentations.
- Useful for exploratory analysis of textual data – find insights, trends, popular topics at a glance.
Available Chart Types in Excel
- Column charts – Useful for comparing categories or showing data over time. Subtypes include clustered, stacked, 100% stacked, 3D.
- Line charts – Best for showing trends over time. Subtypes include line, stacked line, 3D line.
- Pie/doughnut charts – Show percentages or proportions in a circle. Subtypes include pie, pie of pie/bar of pie, doughnut.
- Bar charts – Compare categories side by side. Subtypes include clustered, stacked, 100% stacked, 3D.
- XY (scatter) charts – Show relationships between numeric variables. Subtypes include scatter, scatter with lines, bubble.
- Area charts – Emphasize changes over time or magnitude. Subtypes include area, stacked area, 100% stacked area, 3D area.
- Stock charts – Specifically for financial data trends over time. Subtypes vary based on data included.
- Surface charts – Identify optimal combinations between variables. Subtypes include 3D surface, contour, wireframe.
- Radar/polar charts – Compare multiple variables as rays from the centre. Subtypes include radar, filled radar.
- Map charts (in Excel) – Geographically compare values across regions.
Frequently Asked Questions
Can you make word cloud in Excel?
Yes, you can create word clouds directly in Excel.
Can you do a word cloud in Microsoft Office?
Yes, it is possible to create word clouds in Microsoft Office using a few different applications:
– Excel: As mentioned previously, Excel has a Word Cloud add-in that allows you to turn lists of words into visualized word clouds directly in the worksheet. This is often the easiest option.
– PowerPoint: While there is no built-in word cloud feature, you can copy and paste an Excel word cloud chart into a PowerPoint slide. Or you can use an online word cloud generator tool and paste the resulting image.
– Word: Some third-party Word plugins/add-ins provide word cloud capabilities. For example, the online Word Cloud feature from Instant Word Cloud lets you create and embed dynamic word clouds in Word documents.
– Outlook: The Excel Word Cloud add-in can also be used to analyze email content by exporting messages to Excel first. Online generators may work for pasting word clouds into emails as well.
OneNote: Similar to PowerPoint, there is no native function but you can paste in word clouds created elsewhere like from Excel or online tools.


Leave a Reply